Risk Monitoring [525]
The below table displays the Risk Monitoring or real-time inputs into the X-Margin Credit Evaluation. These metrics are selected from the calculations supported by the X-Margin infrastructure.
X-Margin captures information across the leading CeFI spot, derivatives, and custody venues. Additionally, X-Margin captures DeFi risk across Ethereum, Avalanche, BSC, Polygon, Fantom and 7 other EVM compatible networks. The coverage is constantly expanding, as directed by X-Margin user requests.
| Risk Metric | Calculation |
|---|---|
Assets | Value of portfolio Assets in USD terms across all venues. Includes bilateral loan collateral and Assets borrowed on DeFi and CeFi venues. |
Venue Equity | Value of Equity in USD terms across exchanges. Includes adjustments for Unrealized P&L (UPL), and assets borrowed on Venues. |
Liabilities | Sum of all Liabilities across bilateral loans, DeFi, and CeFi activity. |
Visible Liquidity | Amount of Assets that are viewable through X-Margin's risk monitoring platform. |
SPAN Max Loss | SPAN (Standard Portfolio Analysis of Risk) is a risk methodology made popular by CME Group. X-Margin shocks positions for a single asset up and down in price and volatility, selects the maximum loss across shock scenarios. The price and vol are shocked 10%. Calculations for each discrete asset (e.g., BTC, ETH) are then summed (i.e., no netting across asset classes). |
ABS Delta | Absolute approximated USD Delta. X-Margin converts all assets and derivatives positions (excluding Fiat and stablecoins) assuming a 1:1 correlation. Different asset class positions net out, and X-Margin captures the absolute value of the aggregate. |
Gross Leverage | All asset classes and instruments are converted to a USD amount and summed. There are no offsets across asset classes or venues. |
Uncoll. Borrow | Loan USD Value subtract Collateral USD value, representing any unsecured credit extended to the trading firm. |
The Risk Monitoring Credit Evaluation evaluates ratios of the above metrics. The ratios adequately indicate the real-time creditworthiness of a trading firm, and allow for a uniform comparison methodology.
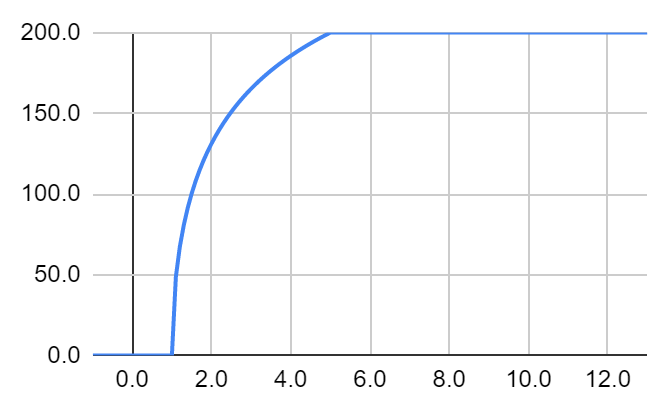
X-Margin uses bounded logarithmic curves to define the change in a score in relation to a change in the underlying ratio. Practically, the curves anchor the top credit score to metrics that are reasonable according to real market activity. Also, curves allow a more severe decline of the score as certain metrics move closer to what would be deemed as high risk.
The below example curve is for a ratio that has a lower bound 1 and upper bound 5. The slope is set at 0.5, resulting in a larger score impact in a move from 1.0 to 2.0 than from 4.0 to 5.0.
Last updated